Health & Data Reports

The Waterbury Health Department shares important local health information to help keep our community informed and healthy.
This section of our website, Health Data & Reports, is organized by health topic. Each topic has its own page where you can find different types of materials, including:
- Dashboards: Interactive tools that show real-time information
- Epidemiology Reports: In-depth studies with charts and trends
- Health Profiles: Short reports about current health issues
- Infographics & Maps: Easy-to-understand visuals that show key data
We will keep adding new topics and materials, so check back often for updates.
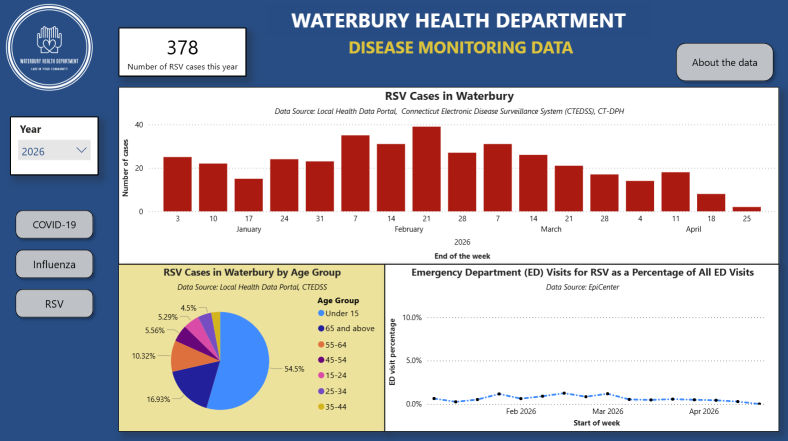
Waterbury Respiratory Viral Disease Monitoring Dashboard
This interactive dashboard provides timely insights into disease activity across the community, helping residents, healthcare providers, and public health professionals make informed decisions.
HEALTH REPORTS
These are in-depth, scientific reports written by public health professionals. They include detailed statistics, charts, and trend analyses on major health issues—such as infectious diseases, chronic conditions, and health behaviors—based on local data in Waterbury. These reports help us understand long-term patterns and guide prevention efforts.
Epidemiology Report: Chlamydia and Gonorrhea in Waterbury (2019–2025)
This report looks at how often chlamydia and gonorrhea have been reported in Waterbury over the past several years. It includes data by age and gender, shows trends over time, and shares tips for prevention.
Download PDFHEALTH PROFILES
Health Profiles are shorter summaries focused on current or emerging health needs in Waterbury. They include quick facts, key data points, and practical suggestions. These are ideal for community members, educators, or anyone looking for fast insights without reading a full scientific report.
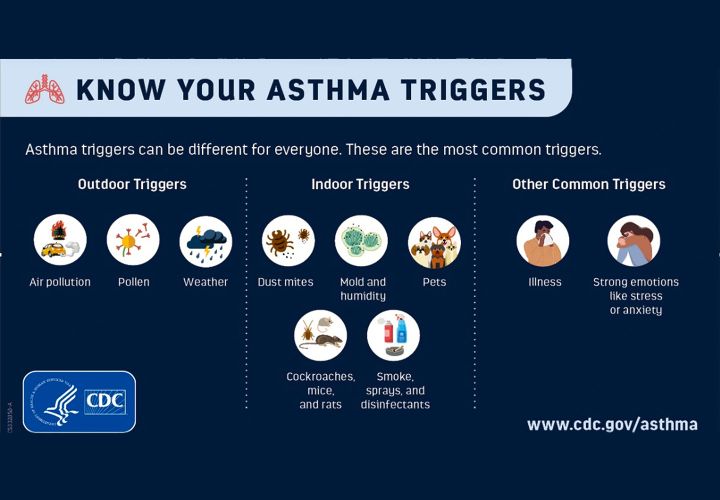
Health Profile: Childhood Asthma
This short report shares information about asthma in kids living in Waterbury. It breaks down who is most affected by age, gender, race, and income, and suggests ways families and the city can help manage asthma.
Download PDFINFOGRAPHICS
Infographics are visual snapshots of health topics. They use simple graphics and short explanations to help people of all ages quickly understand a health issue, such as symptoms, risks, or prevention tips. These are especially useful for schools, social media, or community outreach.
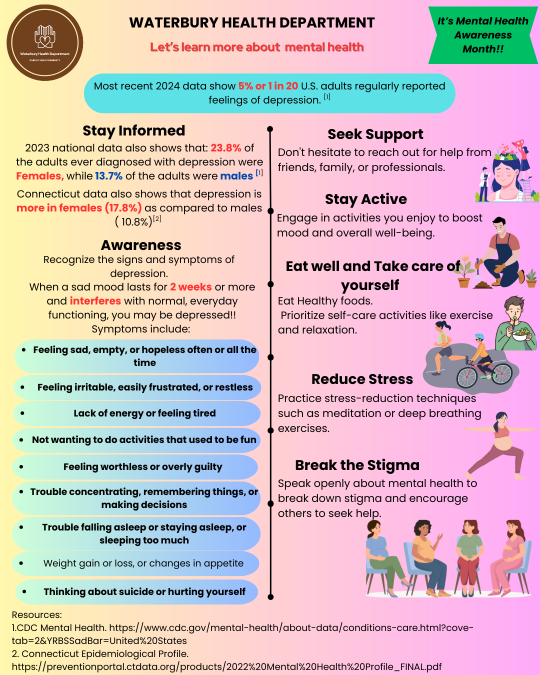
Mental Health Awareness
This infographic helps the public become aware of mental health concerns.
Download PDF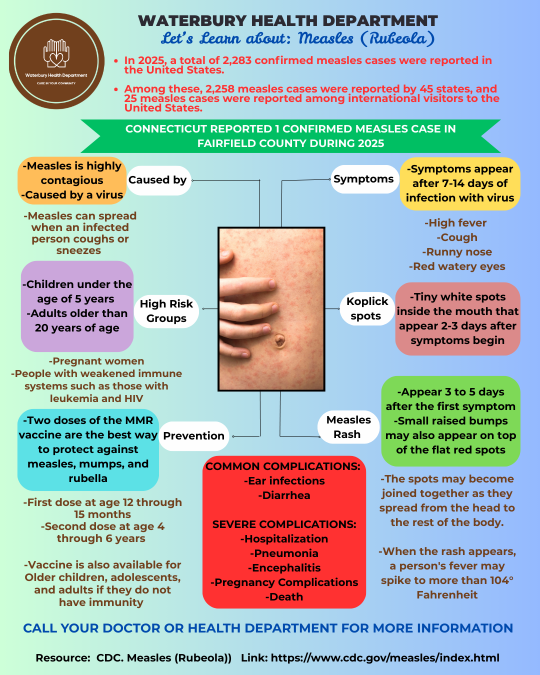
Let’s Learn About: Measles (Rubeola)
This infographic helps the public understand measles, also known as rubeola—a very contagious disease caused by a virus.
Download PDF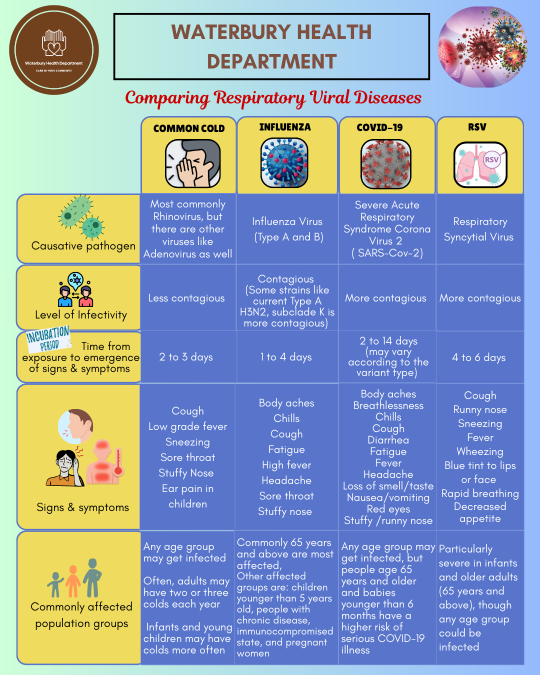
Comparing Respiratory Viral Diseases
This infographic helps the public better understand the key differences between common respiratory viral diseases, including their symptoms, transmission, prevention, and treatment.
Download PDF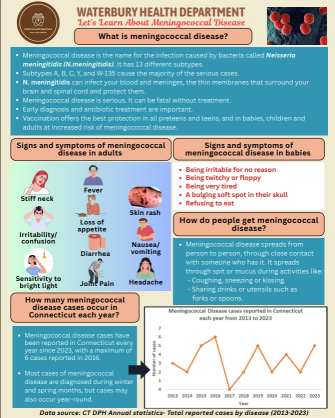
Let’ s Learn About Meningococcal Disease
This infographic helps the public understand Meningococcal Disease
Download PDF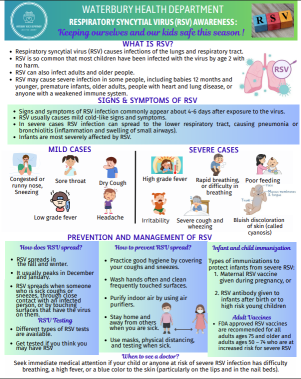
RESPIRATORY SYNCYTIAL VIRUS (RSV) AWARENESS
This infographic helps the public understand RSV
Download PDF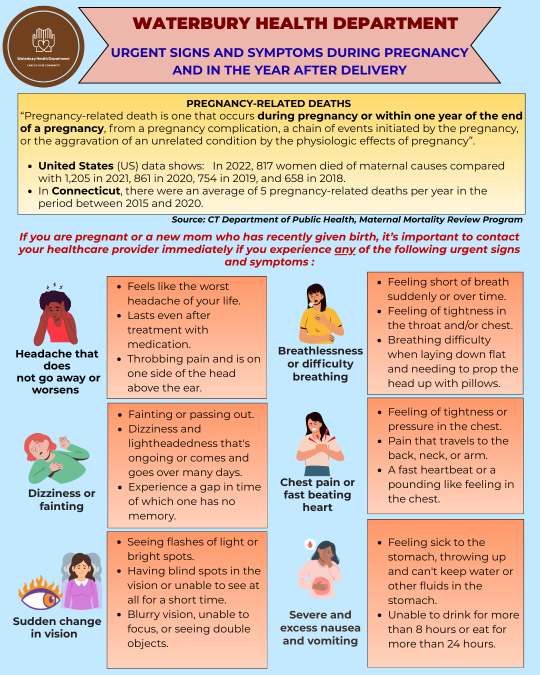
URGENT SIGNS AND SYMPTOMS DURING PREGNANCY AND IN THE YEAR AFTER DELIVERY
This infographic helps the public understand urgent signs and symptoms during pregnancy and in the year after delivery.
Download PDF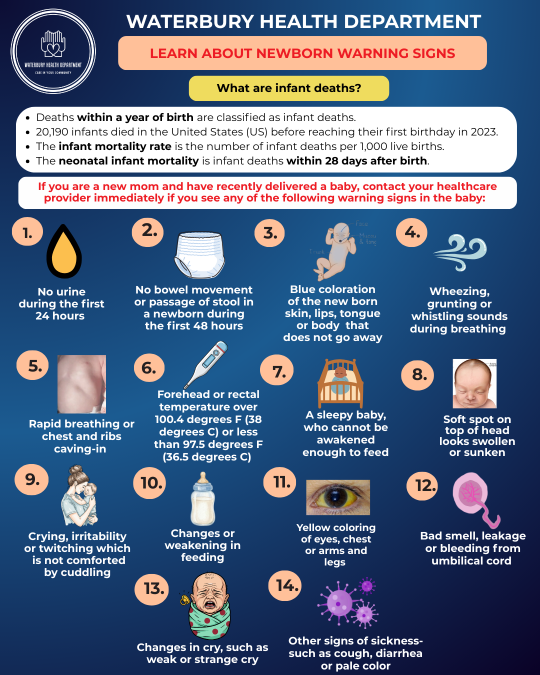
Learn about Newborn Warning Signs
This infographic helps the public understand newborn warning signs
Download PDF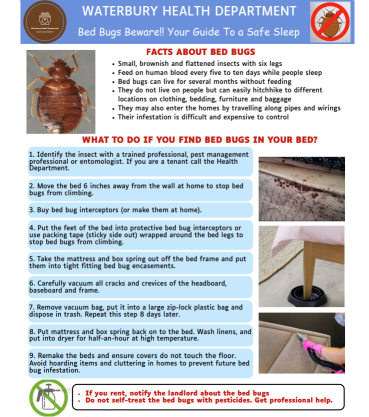
Bed Bugs Beware!! Your Guide To a Safe Sleep
This infographic helps the public understand how to identify bed bugs, learn key facts about them, and take safe, effective steps to prevent and manage infestations.
Download PDF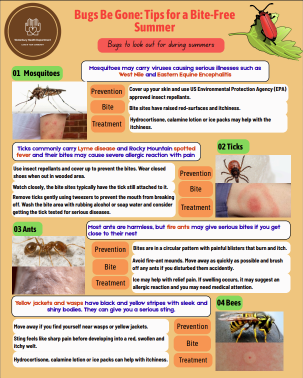
Bugs BeGone: Tipsfor a Bite-Free Summer
This infographic helps the public recognize common summer bugs, understand the health risks they may carry, and learn practical ways to prevent bites and treat reactions safely.
Download PDF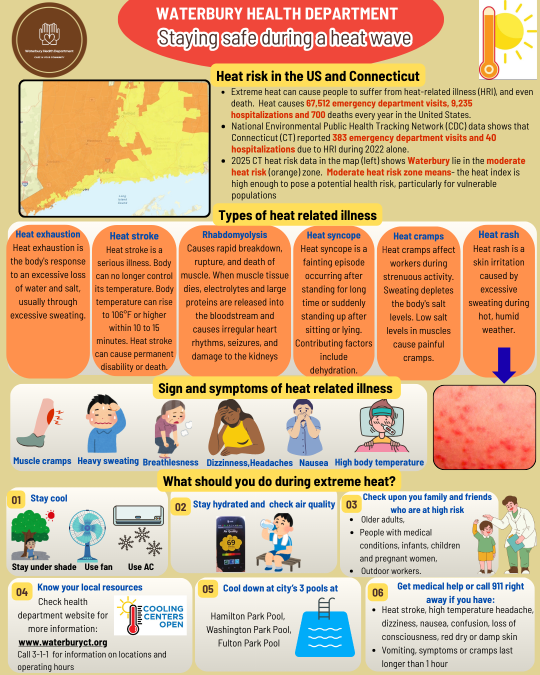
STAYING SAFE DURING A HEAT WAVE
This infographic helps the public understand heat risk in US and Connecticut
Download PDF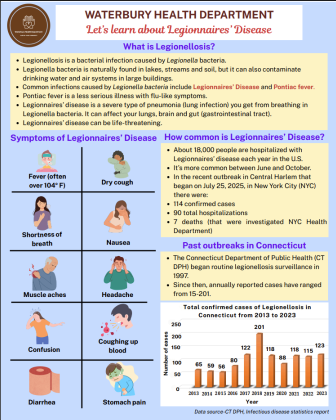
Legionnaires’ Disease
This infographic helps the public understand Legionnaires’ Disease
Download PDFMAPS
Maps show geographic data related to public health across Waterbury. They may show information like which neighborhoods have higher health risks, older housing, or social challenges. Maps help the public and city planners make smarter, more focused health decisions.
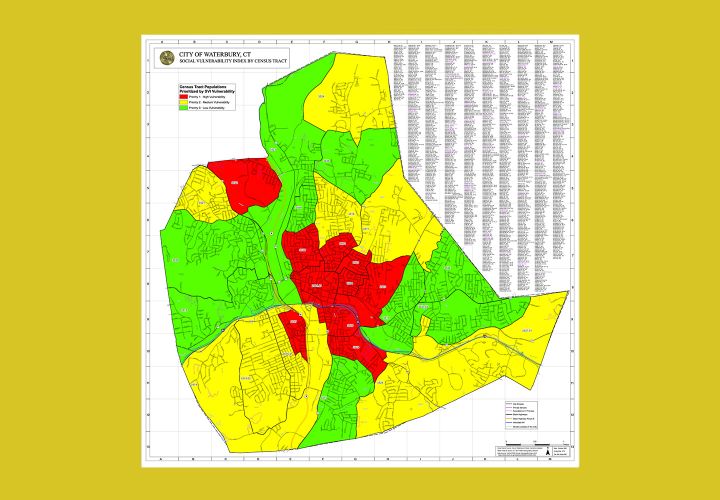
Map: Social Vulnerability Index (SVI)
This map shows which neighborhoods may have more challenges related to income, transportation, housing, and more. It helps us understand where extra support is needed to improve community health.
Download PDF
Map: Age of Housing Structures
This map shows how old buildings are in different areas of Waterbury. Older housing can sometimes mean higher health risks (like mold or lead). This info helps with city planning and health programs.
Download PDFCONNECT WITH CITY-WIDE HEALTHCARE SERVICES
Tap into local healthcare programs and public health professionals who support healthy living in Waterbury.